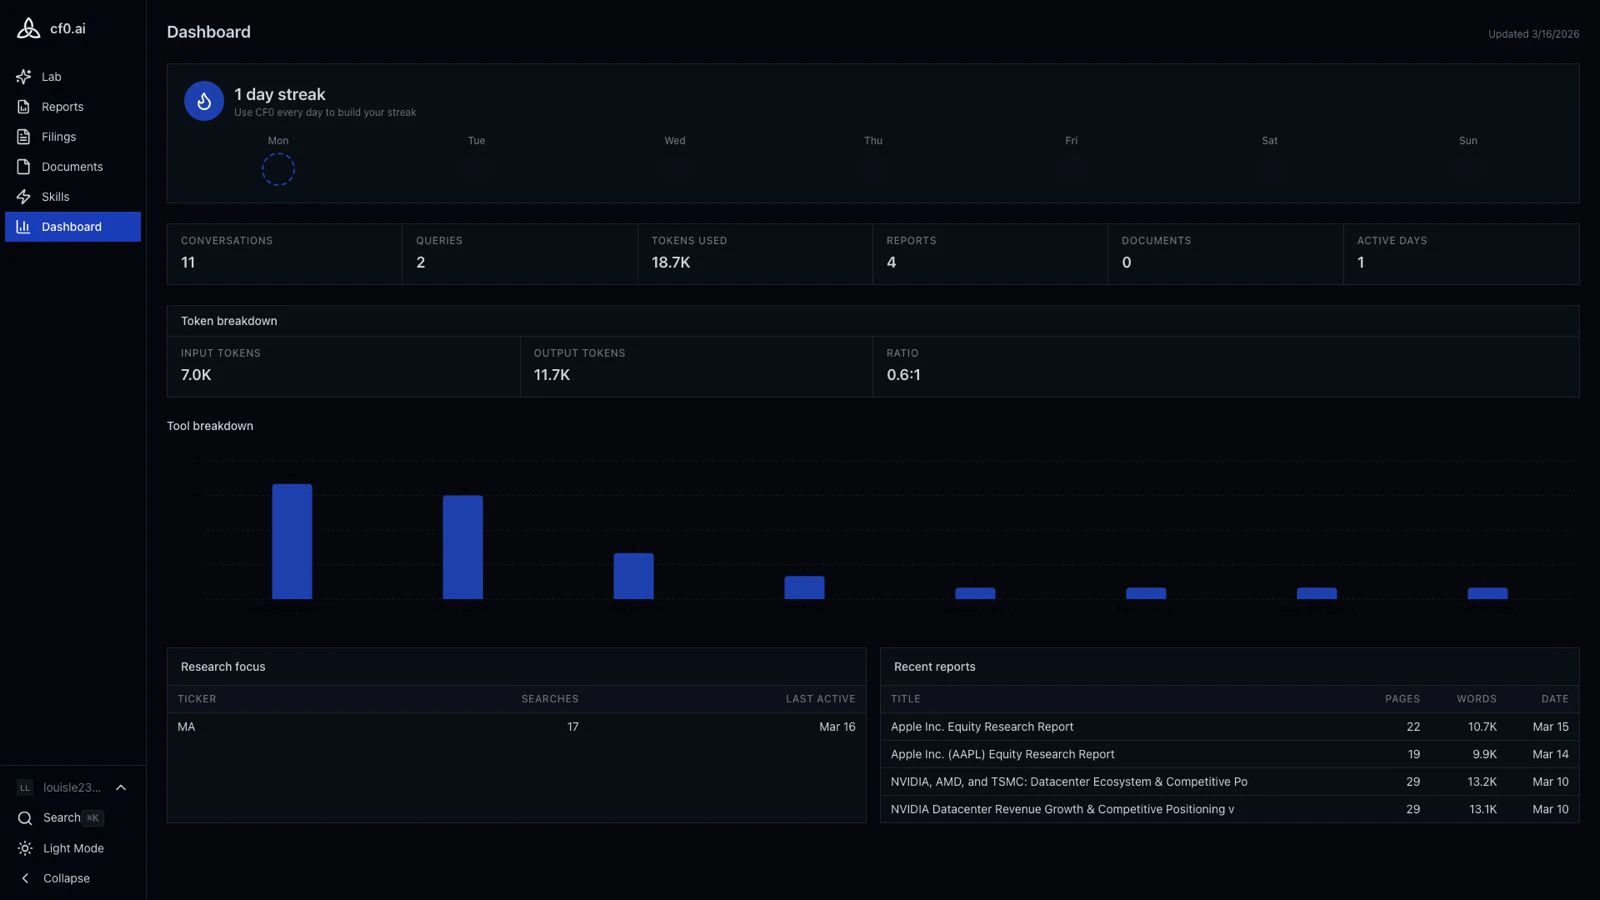
Personal dashboard
Every cf0 user has a personal dashboard showing their own activity:Usage metrics
Your queries, reports generated, and data sources accessed over recent periods.
Activity streak
Week-by-week streak tracker. Build a streak by using Lab, running reports, or browsing filings on consecutive days.
Recent queries
Log of recent Lab queries and reports so you can jump back to past research threads.
Research summary
At-a-glance view of the companies and topics you’ve researched most recently.
Org dashboard (admins only)
If you’re an org admin, you see a second tab — Org dashboard — alongside your personal view. It aggregates activity across all members:- Total queries and reports generated by the team
- Per-member activity summaries (counts and time-on-platform, not thread contents)
- Usage trends over time
The org dashboard shows aggregate activity per member, not the actual contents of anyone’s Lab threads. Thread bodies stay private to the user — admins see “Sarah ran 12 queries this week,” not “here’s what Sarah asked about.” See Lab → Threads.
Reading the dashboard
Five signals an analyst actually uses:| Metric | Signal | When it matters |
|---|---|---|
| Streak | Habit formed | Streak above 5 days = cf0 is in the daily workflow, not just on-demand |
| Tokens used | Depth of research | Low tokens + many queries = surface-level usage; high tokens + few = deep thread work |
| Tool breakdown | What you actually use | Filings-heavy = filings research; chart-heavy = framing decks; skill-heavy = systematic workflows |
| Research focus | Where attention is going | The ticker / sector that dominates your week. Surfaces names you’re under- or over-indexing on |
| Recent reports | Distribution funnel | The flow from Lab thread → exported report → committee. Reports stalled at draft = effort that didn’t ship |