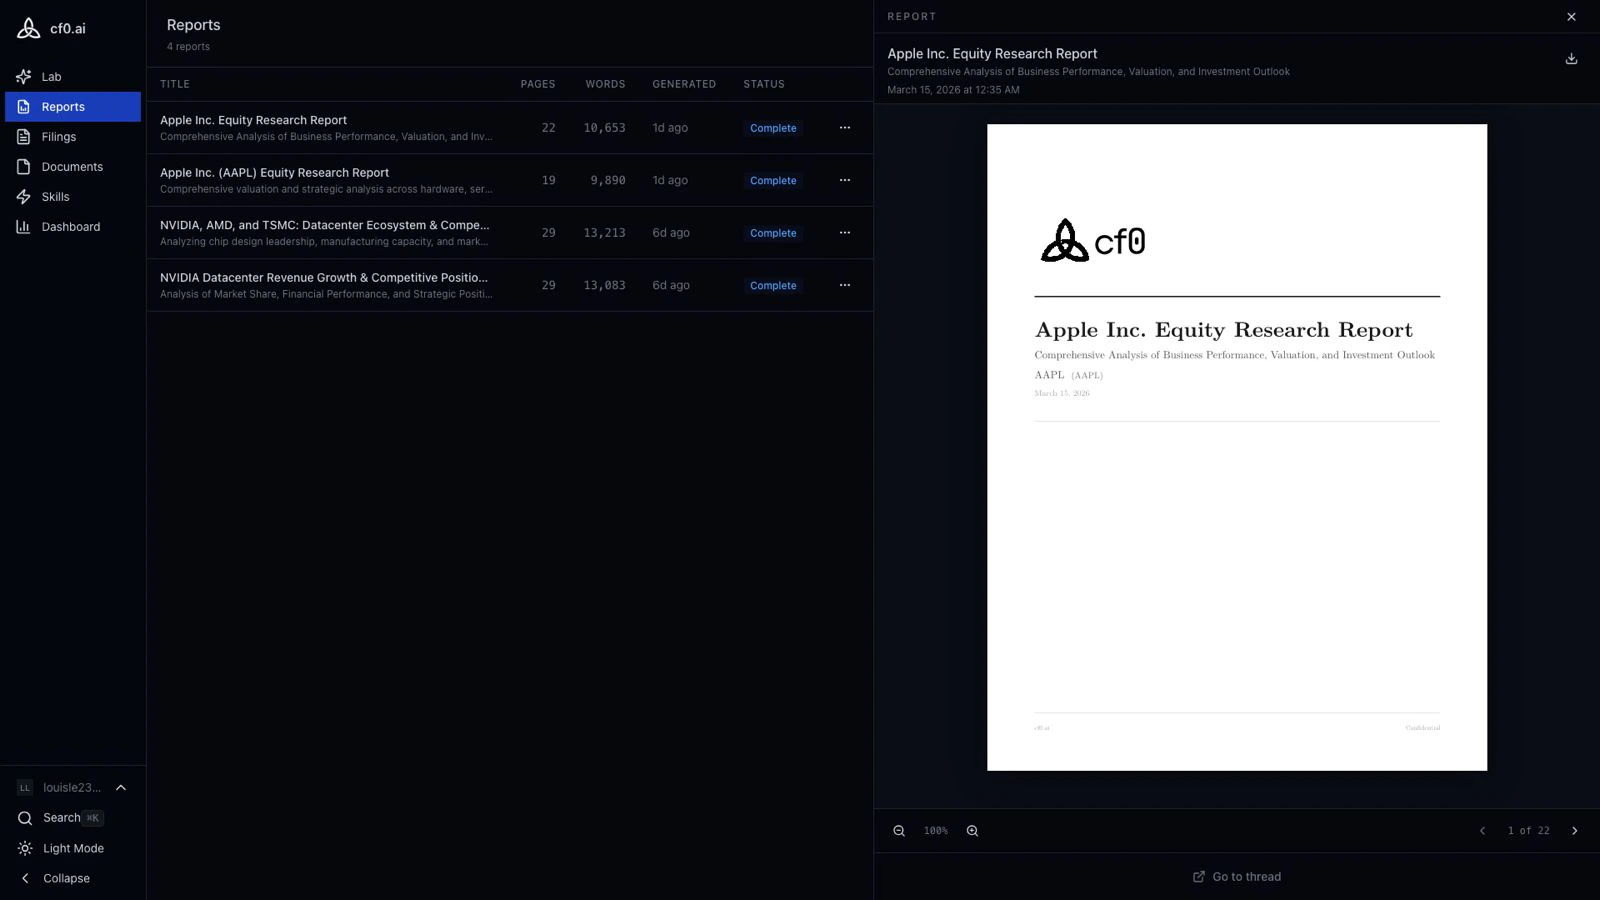
Reports turns a Lab research thread into a publication-ready PDF. The chart, table, and citation work you did in the thread becomes the body of the report; cf0 assembles the cover, sections, footnotes, and Sources Table.
cf0 Reports — browser with PDF preview
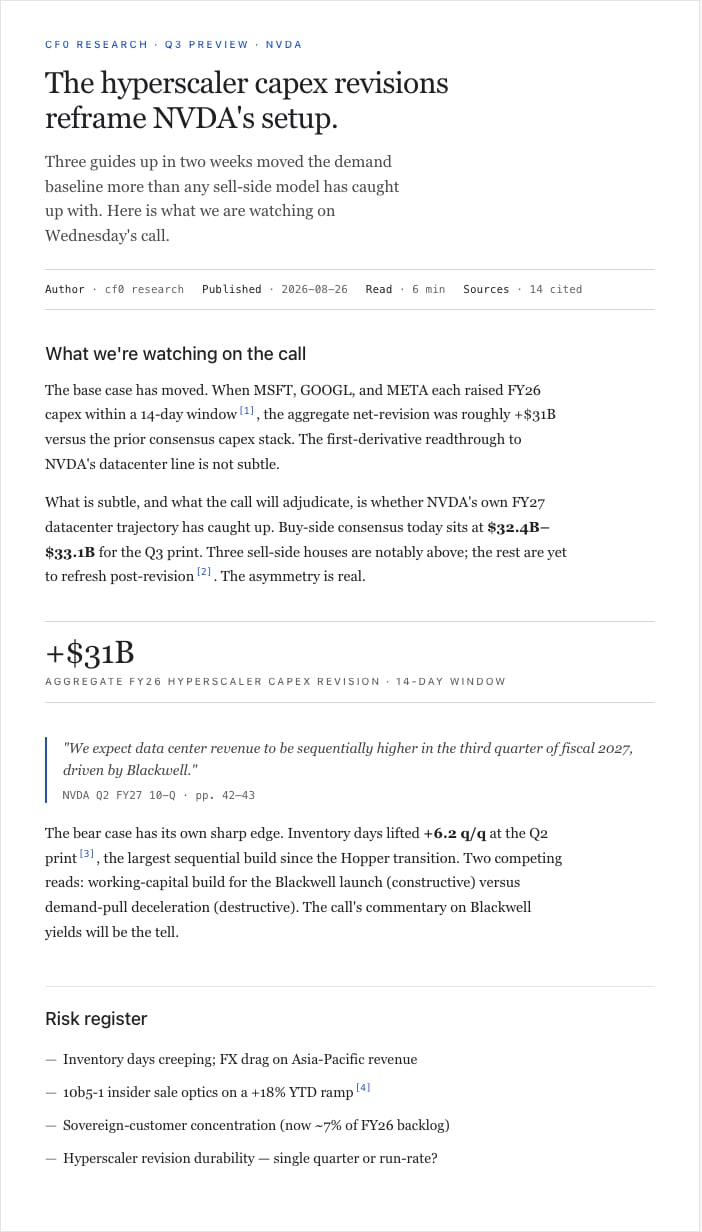
cf0 Report surface — branded cover and body with footnotes

What’s in a report

  • Branded cover — your firm’s logo, colours, and typeface
  • Investment summary and key metrics
  • Charts and tables drawn from the Lab thread (live data, not screenshots)
  • Numbered footnotes anchored to a Sources Table — see Citations and audit trail
  • Key Assumptions table before any valuation, so reviewers can swap inputs and see what drives the model
  • Standard sections — thesis, financials, risks, disclosure

Generate from a Lab thread

1

Run the research in Lab

Complete a research conversation. The more targeted the thread, the tighter the report.
2

Click Generate report

cf0 reads the conversation and drafts the structure automatically.
3

Edit the draft inline

Click any section to edit text directly. Charts and tables pull from the Lab thread and aren’t editable — change them by extending the thread.
4

Export as PDF

Click Export PDF. The report renders in your firm’s brand template and downloads.

Export to Excel and PowerPoint

Beyond PDF, cf0 generates native .xlsx and .pptx from any analysis or uploaded document. Formulas and source links carry through to the spreadsheet; chart objects and section headings carry through to the deck.

Branding

Reports inherit your organisation’s branding automatically. Org admins configure logo, colours, and typeface under Settings → Brand. Every exported PDF reflects those settings — no manual formatting work.

The Reports dashboard

The Reports page (left sidebar) lists every report you’ve generated. From the dashboard you can view a report, jump back to the Lab thread that produced it, or delete it. Deleting a report does not delete the underlying Lab thread.
Last modified on June 5, 2026