A common analyst task: “Compare AAPL and MSFT free cash flow margins over the last five years and flag any quarter where the gap inverted. Then ship a one-pager to the PM.”
In a Bloomberg-and-Excel workflow that’s a 45-minute job. In cf0 it’s three prompts.
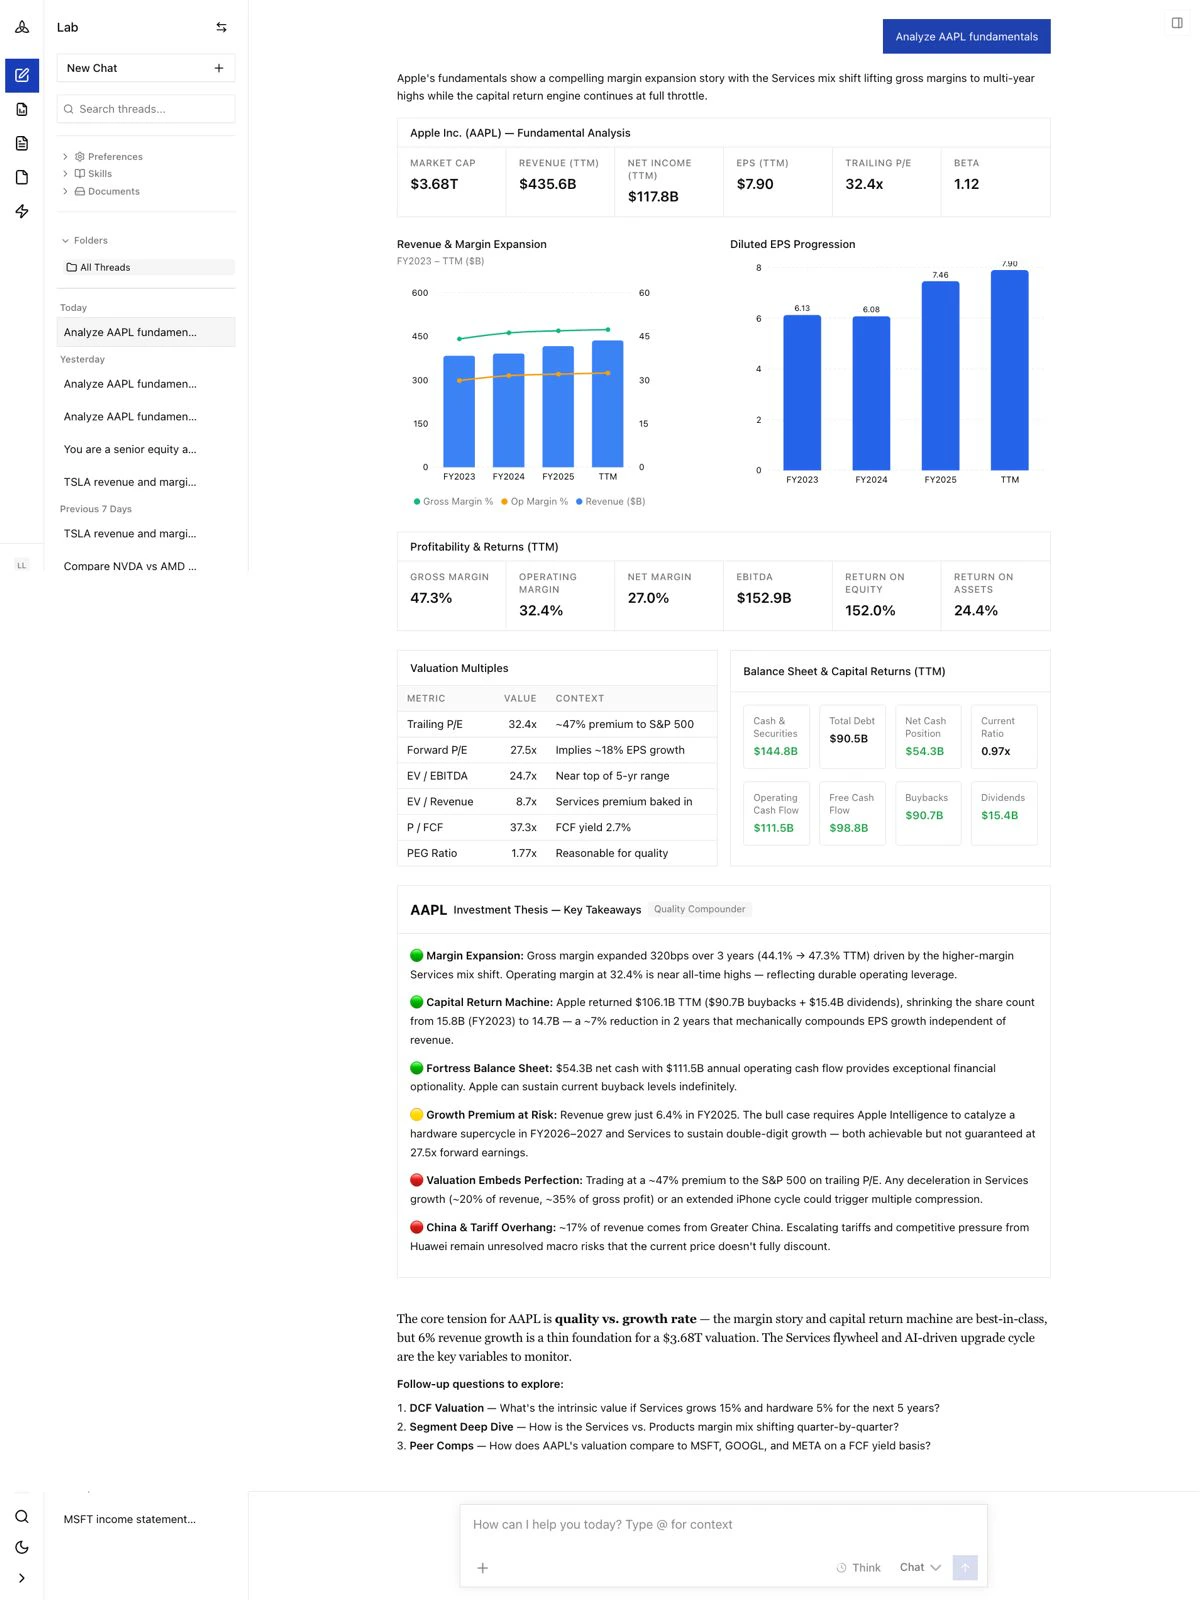
Step 1 — open Lab and ask in plain English
Open Lab from the left sidebar. Type the question:
Compare AAPL and MSFT free cash flow margins over the last five years (FY2021–FY2025). Show me a quarter-by-quarter table, plot the margin time-series, and flag any quarter where MSFT’s margin exceeded AAPL’s.
Lab parses the request, pulls the relevant 10-Ks and 10-Qs, calculates the FCF margins per quarter, and streams:
- A table with quarterly revenue, free cash flow, FCF margin, and the AAPL–MSFT spread for each quarter
- A chart showing both companies’ margin trajectories over the five-year window
- A narrative paragraph identifying the specific quarters where MSFT crossed above AAPL, with a one-line explanation grounded in the underlying filings
- Citations on every figure — click any number to open the source 10-Q or 10-K page
Step 2 — follow up to deepen the analysis
Lab keeps full thread context. Ask a follow-up by reference:
Pull the relevant 10-K paragraphs that explain the margin inversion in the quarter you just flagged.
The agent goes back to the source filings, extracts the relevant management commentary (typically MD&A), and quotes the passage verbatim — citation intact.
Step 3 — generate a one-page PM brief
Once the thread is tight, ask Lab to ship a report:
Generate a one-page brief for the PM summarising the AAPL vs MSFT FCF margin comparison, the inversion quarter(s), and management commentary. Include the chart and the comparison table.
Click Generate report in the thread toolbar (or just ask in chat). cf0 reads the conversation and drafts a branded PDF with:
- Cover page in your firm’s brand template
- Investment summary
- The chart and table from the thread
- Inline citations
- Standard sections (thesis, risk flags, disclosure)
Review the draft inline — click any section to edit text directly. Charts and tables pulled from the Lab thread aren’t editable; they reflect the live data from your analysis. Click Export PDF when you’re happy.
Save it as a Skill
If “compare two names on a single metric and ship a one-pager” is a recurring move for your firm, save the workflow as a Skill:
Now anyone on the team can run the same workflow in one slash command:
cf0 substitutes the variables (AAPL, MSFT, 5y) and runs the full pipeline — pull → compute → chart → cite → draft report — exactly the same way every time.
What just happened
This example used every part of cf0:
- SEC + global filings — the AAPL and MSFT 10-Ks and 10-Qs from SEC EDGAR, parsed into structured sections.
- Lab — the surface where the question came in, the on-demand UI for the chart and table, and the report draft.
- Reports — branded PDF assembly from the Lab thread.
- Skills — captured the workflow so the next run is one slash command.
Citations trace every number back to source. Reports go out in your firm’s brand template. That’s a research session in cf0. Last modified on June 5, 2026