By Filippo Cagliero · cf0 Chief Strategy Officer
Published 30 April 2026 · cf0research.substack.com
Published 30 April 2026 · cf0research.substack.com
Conviction statement. “The fertilizer-to-corn supply chain sits at the intersection of three macro forces active in 2026: geopolitical supply fragmentation, a persistent energy-cost divide between North American and European producers, and a Strait of Hormuz closure that has created the most acute nitrogen and phosphate pricing shock since 2022.”
The pricing shock
The 2022 spike was driven by the Russia invasion. The 2026 spike is driven by Strait of Hormuz disruption and persistent North-American-vs-European natural-gas cost divergence. Both translate directly into urea and ammonia prices — which then translate into farm-gate costs.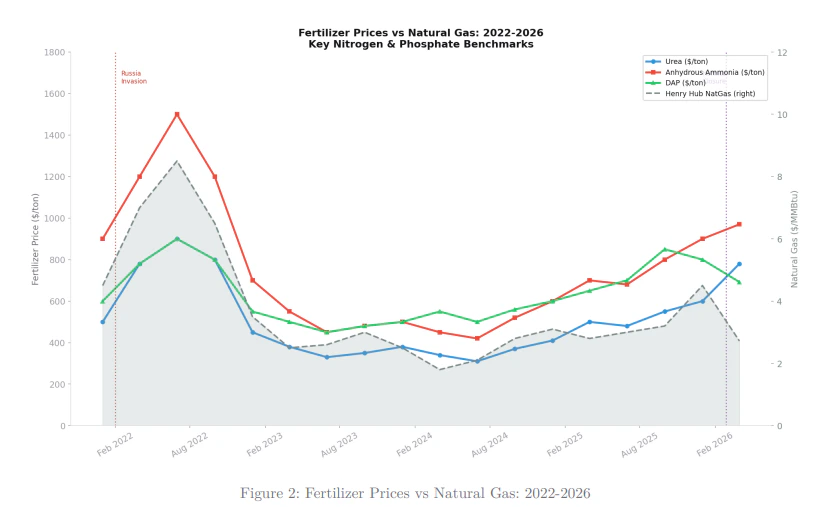
Cost transmission to the farm
The supply-chain waterfall shows how each layer adds to the corn farmer’s per-acre input bill at 2026 elevated pricing. Natural gas feedstock alone contributes 58; logistics another 130/acre.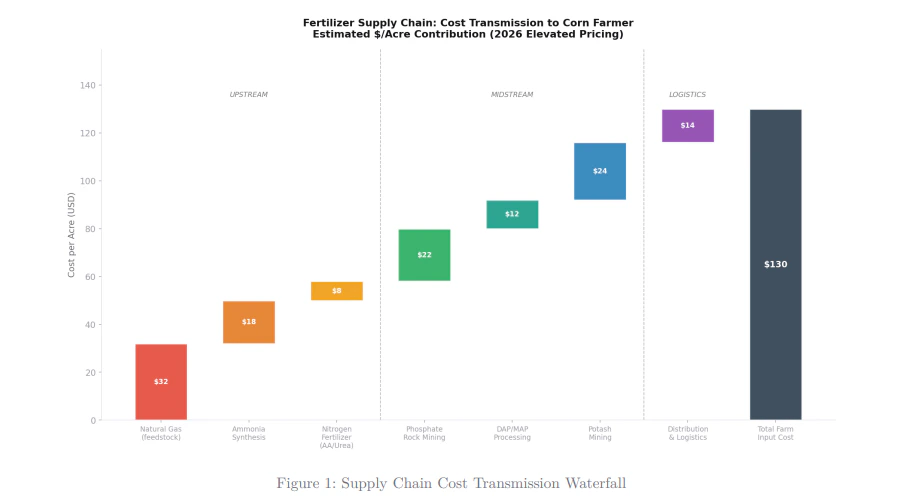
The names exposed at each layer
The comps table below pulls market cap, trailing financials, valuation multiples, beta, and dividend yield for the names sitting at each layer of the chain — Nutrien and CF Industries on nitrogen and potash, Mosaic and ICL Group on phosphate, and the downstream agricultural majors (Corteva, ADM, Bunge).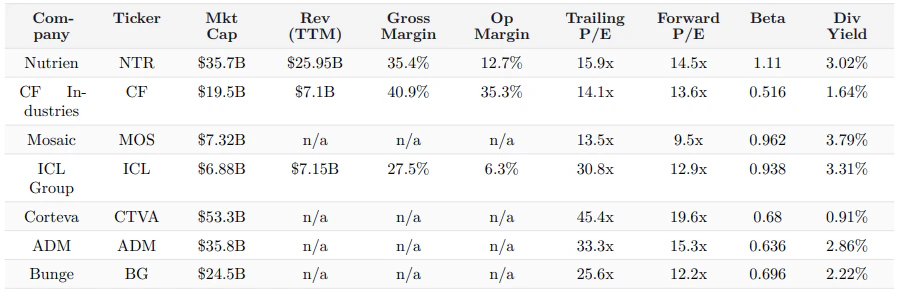
What this used
This note used every part of cf0:- SEC + global filings — 10-Ks and 10-Qs for each name in the supply chain, plus the most recent earnings transcripts.
- Lab — the surface where the pricing shock, the waterfall, and the comps table were all assembled in one thread.
- Knowledge — sector context — supply chain mappings, sovereign policy responses, commodity feeds — pre-compiled and queried inline.
- Reports — exported as a branded PDF for publication.
Read the full note
Fertilizer Supply Chain & Corn Production
Full report — 30 April 2026 · cf0 researchMacro setup, full upstream-to-downstream walk, per-layer name exposure, scenario read across pricing regimes. Open on Substack.