> ## Documentation Index
> Fetch the complete documentation index at: https://docs.cf0.ai/llms.txt
> Use this file to discover all available pages before exploring further.
# Dashboard
> Personal and org-level activity views in cf0. See your research load and streak; admins get aggregated team usage without exposing thread contents.
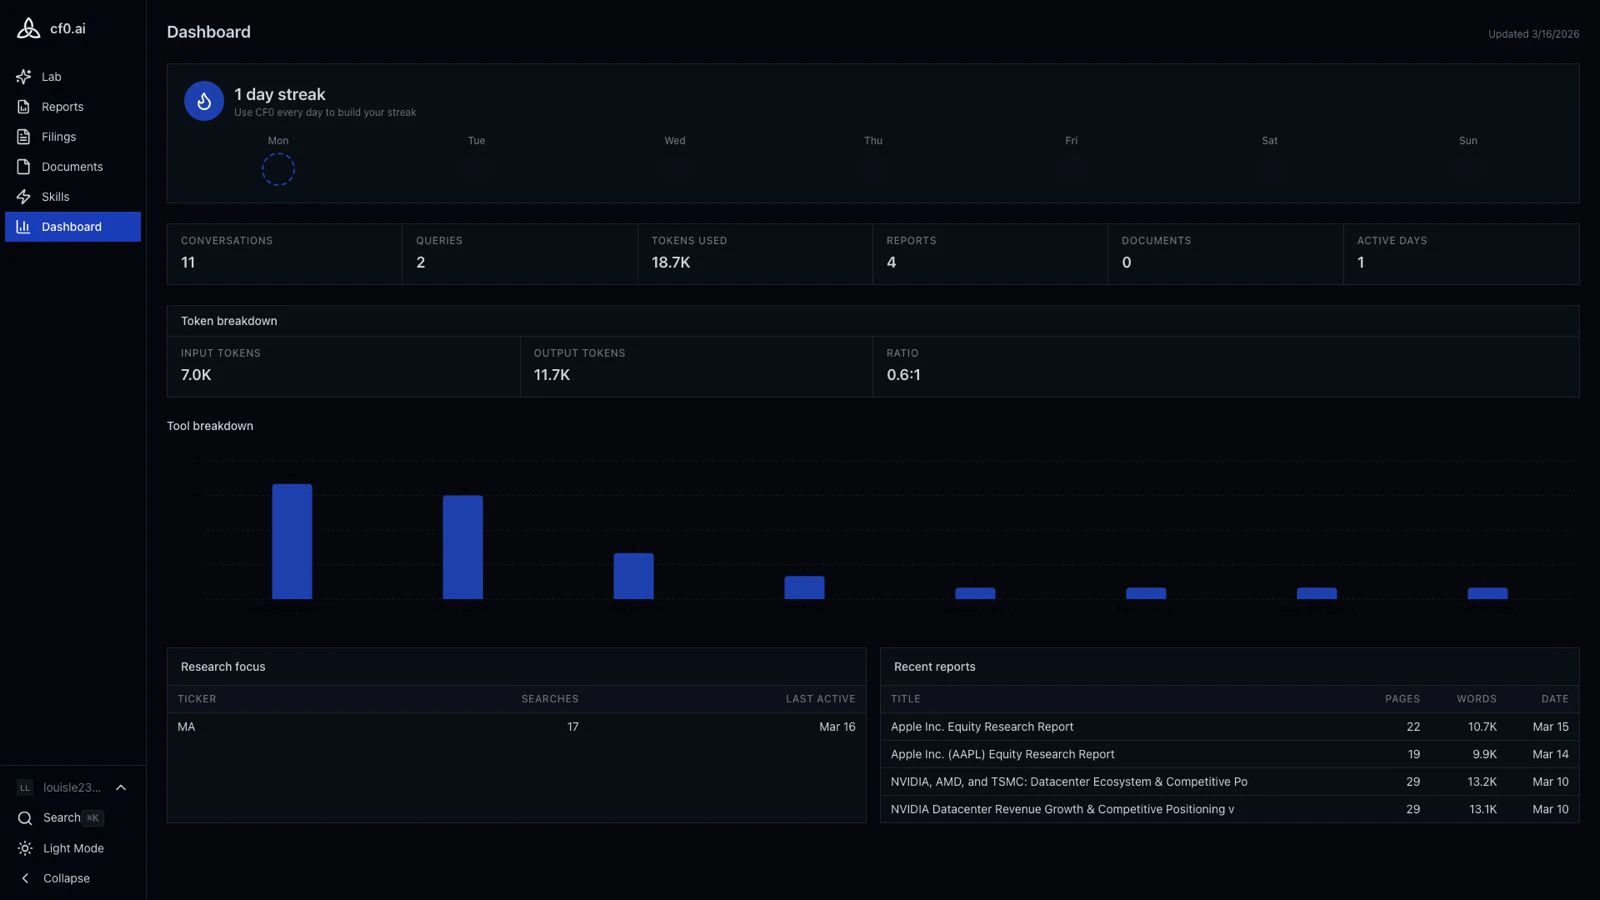
The Dashboard gives you a live view of research activity on cf0. Open it from the left navigation. Updates happen automatically as you work — no refresh required.
 ## Personal dashboard
Every cf0 user has a personal dashboard showing their own activity:
Your queries, reports generated, and data sources accessed over recent periods.
Week-by-week streak tracker. Build a streak by using Lab, running reports, or browsing filings on consecutive days.
Log of recent Lab queries and reports so you can jump back to past research threads.
At-a-glance view of the companies and topics you've researched most recently.
## Org dashboard (admins only)
If you're an org admin, you see a second tab — **Org dashboard** — alongside your personal view. It aggregates activity across all members:
* Total queries and reports generated by the team
* Per-member activity summaries (counts and time-on-platform, **not** thread contents)
* Usage trends over time
The org dashboard shows **aggregate activity per member**, not the actual contents of anyone's Lab threads. Thread bodies stay private to the user — admins see "Sarah ran 12 queries this week," not "here's what Sarah asked about." See [Lab → Threads](/features/lab#threads).
## Reading the dashboard
Five signals an analyst actually uses:
| Metric | Signal | When it matters |
| ------------------ | ------------------------ | ---------------------------------------------------------------------------------------------------------- |
| **Streak** | Habit formed | Streak above 5 days = cf0 is in the daily workflow, not just on-demand |
| **Tokens used** | Depth of research | Low tokens + many queries = surface-level usage; high tokens + few = deep thread work |
| **Tool breakdown** | What you actually use | Filings-heavy = filings research; chart-heavy = framing decks; skill-heavy = systematic workflows |
| **Research focus** | Where attention is going | The ticker / sector that dominates your week. Surfaces names you're under- or over-indexing on |
| **Recent reports** | Distribution funnel | The flow from Lab thread → exported report → committee. Reports stalled at draft = effort that didn't ship |
Use the org dashboard to spot where research effort concentrates across the names your team follows — and where it doesn't. Useful for surfacing under-covered names before the next IC.
## Personal dashboard
Every cf0 user has a personal dashboard showing their own activity:
Your queries, reports generated, and data sources accessed over recent periods.
Week-by-week streak tracker. Build a streak by using Lab, running reports, or browsing filings on consecutive days.
Log of recent Lab queries and reports so you can jump back to past research threads.
At-a-glance view of the companies and topics you've researched most recently.
## Org dashboard (admins only)
If you're an org admin, you see a second tab — **Org dashboard** — alongside your personal view. It aggregates activity across all members:
* Total queries and reports generated by the team
* Per-member activity summaries (counts and time-on-platform, **not** thread contents)
* Usage trends over time
The org dashboard shows **aggregate activity per member**, not the actual contents of anyone's Lab threads. Thread bodies stay private to the user — admins see "Sarah ran 12 queries this week," not "here's what Sarah asked about." See [Lab → Threads](/features/lab#threads).
## Reading the dashboard
Five signals an analyst actually uses:
| Metric | Signal | When it matters |
| ------------------ | ------------------------ | ---------------------------------------------------------------------------------------------------------- |
| **Streak** | Habit formed | Streak above 5 days = cf0 is in the daily workflow, not just on-demand |
| **Tokens used** | Depth of research | Low tokens + many queries = surface-level usage; high tokens + few = deep thread work |
| **Tool breakdown** | What you actually use | Filings-heavy = filings research; chart-heavy = framing decks; skill-heavy = systematic workflows |
| **Research focus** | Where attention is going | The ticker / sector that dominates your week. Surfaces names you're under- or over-indexing on |
| **Recent reports** | Distribution funnel | The flow from Lab thread → exported report → committee. Reports stalled at draft = effort that didn't ship |
Use the org dashboard to spot where research effort concentrates across the names your team follows — and where it doesn't. Useful for surfacing under-covered names before the next IC.