> ## Documentation Index
> Fetch the complete documentation index at: https://docs.cf0.ai/llms.txt
> Use this file to discover all available pages before exploring further.
# Fertilizer supply chain
> Walkthrough of a cf0 research note covering the full fertilizer ecosystem — upstream nitrogen and phosphate through midstream logistics into corn economics.
**By Filippo Cagliero** · cf0 Chief Strategy Officer\
**Published** 30 April 2026 · [cf0research.substack.com](https://cf0research.substack.com/p/fertilizer-supply-chain-and-corn)
This is a real cf0 research note, produced inside Lab by cf0's CSO and published on Substack. The thread walked the full ecosystem — upstream nitrogen and phosphate producers, midstream logistics, downstream corn economics — and tied every name to the real-time pricing data behind it.
**Conviction statement.** *"The fertilizer-to-corn supply chain sits at the intersection of three macro forces active in 2026: geopolitical supply fragmentation, a persistent energy-cost divide between North American and European producers, and a Strait of Hormuz closure that has created the most acute nitrogen and phosphate pricing shock since 2022."*
## The pricing shock
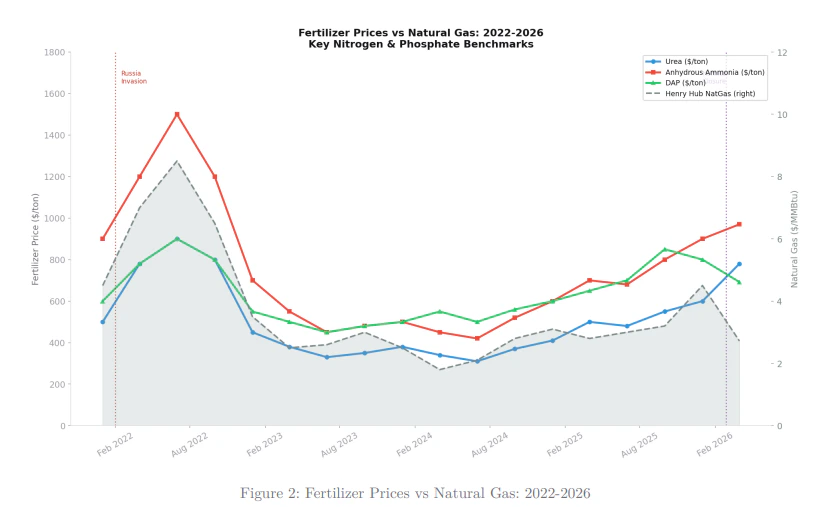
The 2022 spike was driven by the Russia invasion. The 2026 spike is driven by Strait of Hormuz disruption and persistent North-American-vs-European natural-gas cost divergence. Both translate directly into urea and ammonia prices — which then translate into farm-gate costs.
 ## Cost transmission to the farm
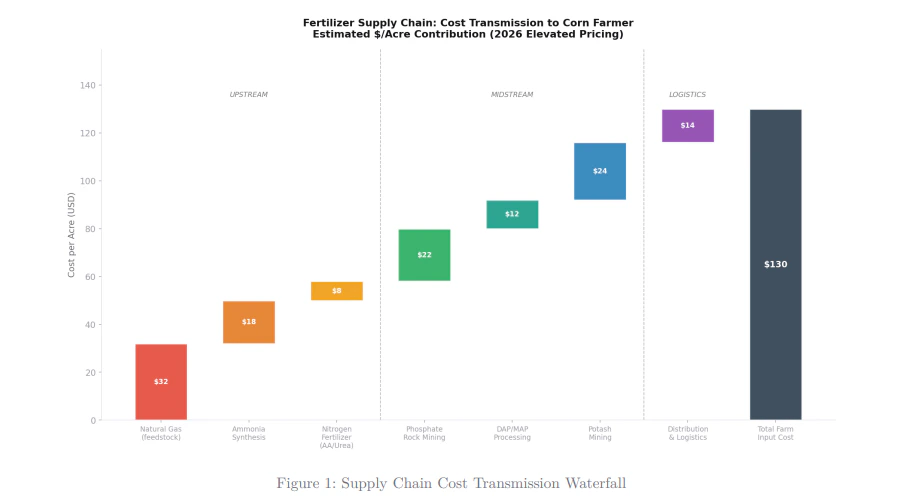
The supply-chain waterfall shows how each layer adds to the corn farmer's per-acre input bill at 2026 elevated pricing. Natural gas feedstock alone contributes $32/acre; midstream phosphate and potash mining add another $58; logistics another $14. Total: $130/acre.
## Cost transmission to the farm
The supply-chain waterfall shows how each layer adds to the corn farmer's per-acre input bill at 2026 elevated pricing. Natural gas feedstock alone contributes $32/acre; midstream phosphate and potash mining add another $58; logistics another $14. Total: $130/acre.
 The implication for portfolio construction is that exposure to nitrogen is a different bet from exposure to potash: nitrogen is a natural-gas derivative, potash is a mining play, and the two correlate only loosely.
## The names exposed at each layer
The comps table below pulls market cap, trailing financials, valuation multiples, beta, and dividend yield for the names sitting at each layer of the chain — Nutrien and CF Industries on nitrogen and potash, Mosaic and ICL Group on phosphate, and the downstream agricultural majors (Corteva, ADM, Bunge).
The implication for portfolio construction is that exposure to nitrogen is a different bet from exposure to potash: nitrogen is a natural-gas derivative, potash is a mining play, and the two correlate only loosely.
## The names exposed at each layer
The comps table below pulls market cap, trailing financials, valuation multiples, beta, and dividend yield for the names sitting at each layer of the chain — Nutrien and CF Industries on nitrogen and potash, Mosaic and ICL Group on phosphate, and the downstream agricultural majors (Corteva, ADM, Bunge).
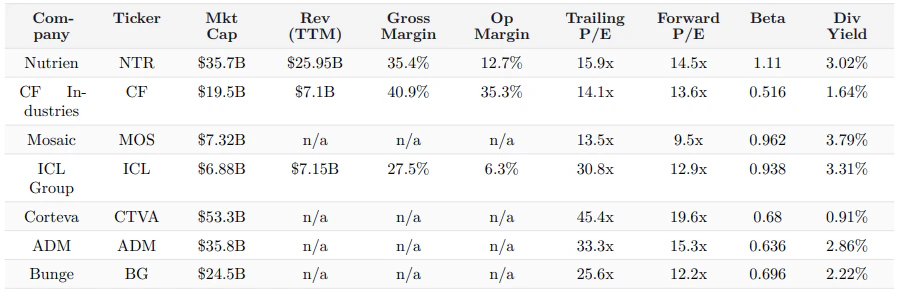 The dispersion across margin profiles is significant: CF Industries runs \~35% operating margins because nitrogen is integrated and gas is its only meaningful input, while ADM and Corteva sit at the downstream side with diluted margins but broader exposure to the food-chain revenue base.
## What this used
This note used every part of cf0:
* **SEC + global filings** — 10-Ks and 10-Qs for each name in the supply chain, plus the most recent earnings transcripts.
* **Lab** — the surface where the pricing shock, the waterfall, and the comps table were all assembled in one thread.
* **Knowledge** — sector context — supply chain mappings, sovereign policy responses, commodity feeds — pre-compiled and queried inline.
* **Reports** — exported as a branded PDF for publication.
Commodity price feeds drove the chart; per-name fundamentals came from filings; sector context came from cf0's compiled knowledge surface. Every figure cites back.
## Read the full note
**Full report — 30 April 2026 · cf0 research**
Macro setup, full upstream-to-downstream walk, per-layer name exposure, scenario read across pricing regimes. Open on Substack.
## Next walkthrough
→ [Bricks Beat Bytes](/examples/bricks-beat-bytes) — the 2026 HALO thesis from cf0 research.
The dispersion across margin profiles is significant: CF Industries runs \~35% operating margins because nitrogen is integrated and gas is its only meaningful input, while ADM and Corteva sit at the downstream side with diluted margins but broader exposure to the food-chain revenue base.
## What this used
This note used every part of cf0:
* **SEC + global filings** — 10-Ks and 10-Qs for each name in the supply chain, plus the most recent earnings transcripts.
* **Lab** — the surface where the pricing shock, the waterfall, and the comps table were all assembled in one thread.
* **Knowledge** — sector context — supply chain mappings, sovereign policy responses, commodity feeds — pre-compiled and queried inline.
* **Reports** — exported as a branded PDF for publication.
Commodity price feeds drove the chart; per-name fundamentals came from filings; sector context came from cf0's compiled knowledge surface. Every figure cites back.
## Read the full note
**Full report — 30 April 2026 · cf0 research**
Macro setup, full upstream-to-downstream walk, per-layer name exposure, scenario read across pricing regimes. Open on Substack.
## Next walkthrough
→ [Bricks Beat Bytes](/examples/bricks-beat-bytes) — the 2026 HALO thesis from cf0 research.