> ## Documentation Index
> Fetch the complete documentation index at: https://docs.cf0.ai/llms.txt
> Use this file to discover all available pages before exploring further.
# Bricks Beat Bytes
> Walkthrough of the 2026 HALO thesis — a cf0 research note arguing physical infrastructure beats AI software, assembled end-to-end in Lab with cited figures.
**By Filippo Cagliero** · cf0 Chief Strategy Officer\
**Published** 8 May 2026 · [cf0research.substack.com](https://cf0research.substack.com/p/bricks-beat-bytes-the-2026-halo-trade)
This is a real cf0 research note, produced inside Lab by cf0's CSO and published on Substack. Filings, macro data, and market series all flowed through one thread; every figure carries a citation back to its source.
**Conviction statement.** *"The physical infrastructure — power, cooling, aerospace, defense, rail — is underowned, undervalued, and entering a multi-year capex cycle with sovereign backing."*
## The HALO thesis in one chart
A structural rotation toward companies whose moats rest on heavy physical assets — assets that take decades to replicate and cannot be coded away. The risk-return scatter below frames the case: HALO names cluster top-left (better risk-adjusted return than the AI basket), while a handful of AI names sit further right on the volatility axis.
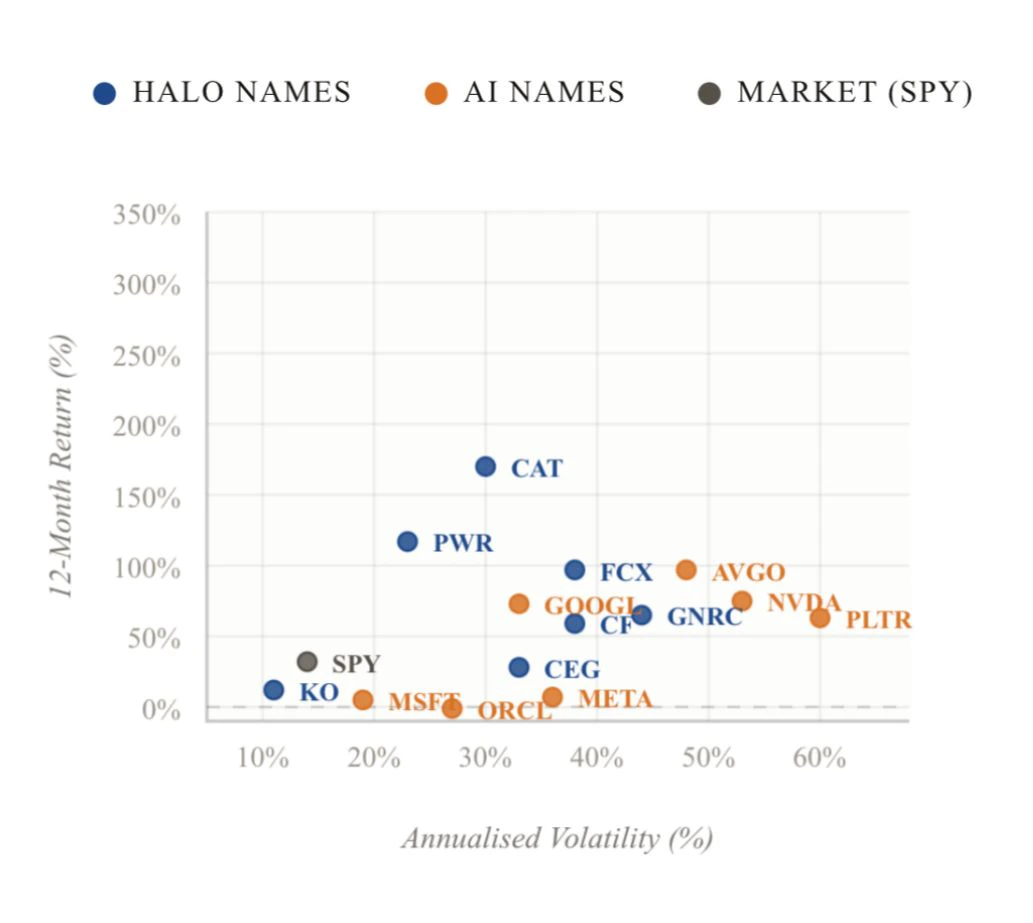 For portfolio managers, the basket offers valuation relief from stretched AI names while capturing the infrastructure tailwinds that underpin long-term productivity. Goldman Sachs' asset-heavy basket has outperformed asset-light peers by \~35% since the start of 2025, with the spread accelerating \~25 percentage points since November 2025.
## The six themes powering it
The note decomposes the thesis into six themes, each with a near-term momentum score and a 2027 durability read. Concentration risk is flagged where a theme leans heavily on a single name.
For portfolio managers, the basket offers valuation relief from stretched AI names while capturing the infrastructure tailwinds that underpin long-term productivity. Goldman Sachs' asset-heavy basket has outperformed asset-light peers by \~35% since the start of 2025, with the spread accelerating \~25 percentage points since November 2025.
## The six themes powering it
The note decomposes the thesis into six themes, each with a near-term momentum score and a 2027 durability read. Concentration risk is flagged where a theme leans heavily on a single name.
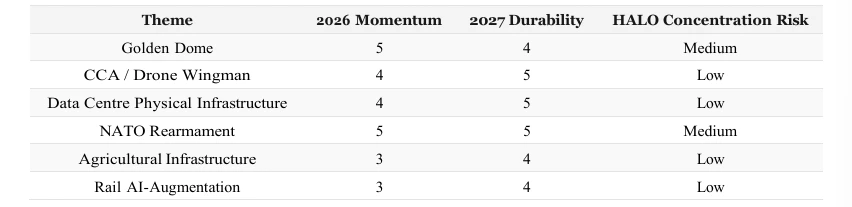 The macro backdrop favours all six: $900.6B in authorised US defence spending for 2026, NATO's 5%-of-GDP-by-2035 commitment (~$2.7T cumulative), and \~\$1.5T of hyperscaler AI infrastructure capex through 2026 — which itself flows to power generation, cooling, land, and steel rather than software.
## How each name maps across themes
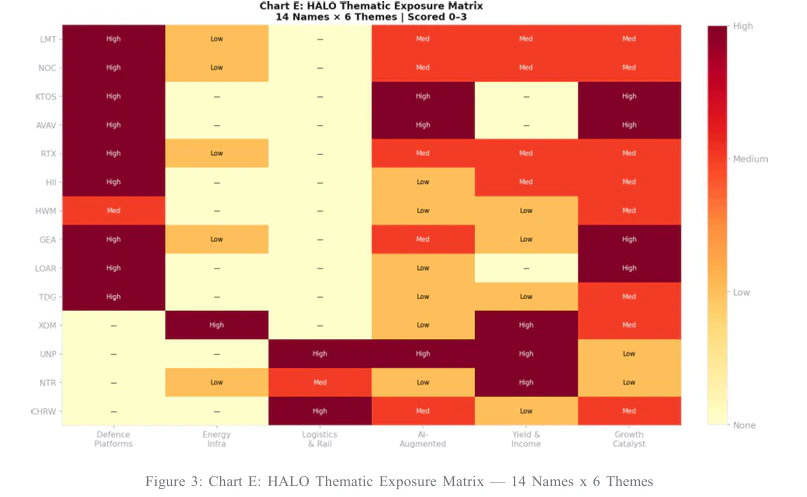
The heatmap below scores fourteen HALO names against the six themes — useful for spotting where exposure concentrates (defence platforms is heavy across LMT / NOC / KTOS / AVAV / RTX / HII / GEA / LOAR / TDG) and where it doesn't (energy infra has one name; logistics & rail has three).
The macro backdrop favours all six: $900.6B in authorised US defence spending for 2026, NATO's 5%-of-GDP-by-2035 commitment (~$2.7T cumulative), and \~\$1.5T of hyperscaler AI infrastructure capex through 2026 — which itself flows to power generation, cooling, land, and steel rather than software.
## How each name maps across themes
The heatmap below scores fourteen HALO names against the six themes — useful for spotting where exposure concentrates (defence platforms is heavy across LMT / NOC / KTOS / AVAV / RTX / HII / GEA / LOAR / TDG) and where it doesn't (energy infra has one name; logistics & rail has three).
 ## What this used
This note used every part of cf0:
* **SEC + global filings** — 10-Ks and 10-Qs for each HALO and AI name, pulled and parsed.
* **Lab** — the surface where the thesis was framed; one thread held the macro setup, the screener output, the per-name tearsheets, the scenario sensitivity, and the chart inputs.
* **Skills** — recurring research moves bound to a slug, so the same scenario / sensitivity passes can be re-run on a new ticker in one command.
* **Reports** — the polished output exported as a branded PDF before publication to Substack.
Every figure cites its source. Macro spending numbers trace to the NDAA appropriations text and NATO Hague Summit Declaration; ETF mechanics to the Roundhill prospectus on SEC EDGAR; per-name returns to public market data.
## Read the full note
**Full report — 8 May 2026 · cf0 research**
Conviction statement, macro setup, theme-by-theme deep dive, LOHA ETF mechanics, fourteen company tearsheets, scenario sensitivity, and follow-up questions. Open on Substack.
## Next walkthrough
→ [Fertilizer supply chain](/examples/fertilizer-supply-chain) — a sector ecosystem analysis from cf0 research.
## What this used
This note used every part of cf0:
* **SEC + global filings** — 10-Ks and 10-Qs for each HALO and AI name, pulled and parsed.
* **Lab** — the surface where the thesis was framed; one thread held the macro setup, the screener output, the per-name tearsheets, the scenario sensitivity, and the chart inputs.
* **Skills** — recurring research moves bound to a slug, so the same scenario / sensitivity passes can be re-run on a new ticker in one command.
* **Reports** — the polished output exported as a branded PDF before publication to Substack.
Every figure cites its source. Macro spending numbers trace to the NDAA appropriations text and NATO Hague Summit Declaration; ETF mechanics to the Roundhill prospectus on SEC EDGAR; per-name returns to public market data.
## Read the full note
**Full report — 8 May 2026 · cf0 research**
Conviction statement, macro setup, theme-by-theme deep dive, LOHA ETF mechanics, fourteen company tearsheets, scenario sensitivity, and follow-up questions. Open on Substack.
## Next walkthrough
→ [Fertilizer supply chain](/examples/fertilizer-supply-chain) — a sector ecosystem analysis from cf0 research.